Iwata on Nintendo’s digital business, steady progress being made
Posted on 9 years ago by Brian(@NE_Brian) in 3DS eShop, News, Wii U eShop | 13 Comments


Now, I would like to explain the progress in our digital business, which will play a very important role in our efforts to expand our business.
These graphs show the download sales transitions in the recent three financial years.
Our download sales as of the end of the second quarter of this fiscal year were a bit lower than those in the previous fiscal year. Yet, the most recent nine-month download sales showed a year-on-year increase of 17 percent to reach 21.1 billion yen.These are the regional download sales breakdowns for the nine months of this fiscal year and the previous one.
You can see the decrease of the ratio of the Japanese market, where there were some hit titles including “StreetPass Mii Plaza” and “Rusty’s Real Deal Baseball” in the last fiscal year. In contrast, the Americas dramatically increased its proportion, followed by Europe.In the U.S., purchases of digital products in general have been widely accepted by consumers. As a result, the ratio of people who purchase and download digital game software is high. As you can see, when we focus on the Americas and create a chart of the download sales percentage of the total software sales, the ratio of the download sales has been increasing largely in the most recent three fiscal years.
Of course, there are some gift-giving opportunities such as holidays and birthdays when packaged software is preferred over the digital version. Yet, as we have been continuing our various efforts in this field, I hope you can see that Nintendo’s digital business is making steady progress. Specifically, not to mention the increased purchasing at Nintendo eShop on Wii U and Nintendo 3DS, our efforts to increase digital purchasing opportunities, such as via online e-commerce sites that we mentioned during the previous Corporate Management Policy Briefing, have been showing results.
Iwata on amiibo success and sales
Posted on 9 years ago by Brian(@NE_Brian) in General Nintendo, News | 3 Comments


We also launched amiibo, our new category of products, at the same time as “Super Smash Bros. for Wii U.”
We had already shipped 5.7 million units worldwide by the end of last year.
amiibo is performing especially well in the U.S., Canada and Australia. Some figures are sold out and are being sold at online auctions at premium prices – something which none of us had predicted.I can say that amiibo has kicked off smoothly, as it is a brand-new product category, launched with a much lower recognition rate than other action figure related proposals from other companies.
First of all, amiibo is a series of “game-connectable figures” supported by multiple titles.
“Super Smash Bros.” was the first title to support amiibo, followed by “Mario Kart 8,” “Captain Toad: Treasure Tracker,” and “Kirby and the Rainbow Curse.” We are planning further compatibility in various software titles.
amiibo is offered at a more affordable price range than packaged game titles, so consumers may feel the hurdle has been lowered to buy them one by one without seasonal gaps. In fact, considering the recent sales, amiibo has shown a smaller decline after the year-end sales season in various markets in the world than packaged titles. Also, I think amiibo can contribute to maintaining active use rates of Nintendo platforms by periodically bringing fresh topics to the applicable software through releases of new amiibo figures.
The first amiibo series after “Super Smash Bros.” will be “Super Mario,” which is compatible with “Mario Party 10.”
We are going to add various changes to the appearances of amiibo store shelves including the “Super Smash Bros.” series. As store shelf space is limited, some amiibo may become standard models while others may be replaced once they sell out.
If this is possible, amiibo will maintain a constant presence in stores, which will be beneficial for all Nintendo platforms.This is a pie chart indicating the regional shipment breakdown of amiibo from its launch until the sixth week of this calendar year.
As you can see at a glance, the sector in red representing the U.S. and Canada accounts for a significant portion: 63 percent. The sell-through proportion of the total shipment is approximately 70 percent in each of Japan, U.S. and Canada, and Europe while it reaches 90 percent in Australia.This is the regional top sales ranking chart of each amiibo figure. This does not perfectly represent the popularity or demand for each character because some amiibo were out-of-stock in some regions, but you can certainly see some regional differences in the sales trends.
This chart shows the amiibo figures with a high retail sell-through rate in each region. Some of the amiibo listed here are already sold out and are now difficult to obtain.
It is difficult for us to promise to continuously ship all of the amiibo figures. We will, however, consider additional production in cases such as when an amiibo figure sells out shortly after launch, an amiibo is indispensable to play a certain game, and when we receive a lot of requests for an amiibo figure from consumers and retailers.
Preliminary sales data for Zelda: Majora’s Mask 3D, Monster Hunter 4 Ultimate
Posted on 9 years ago by Brian(@NE_Brian) in 3DS, News | 3 Comments
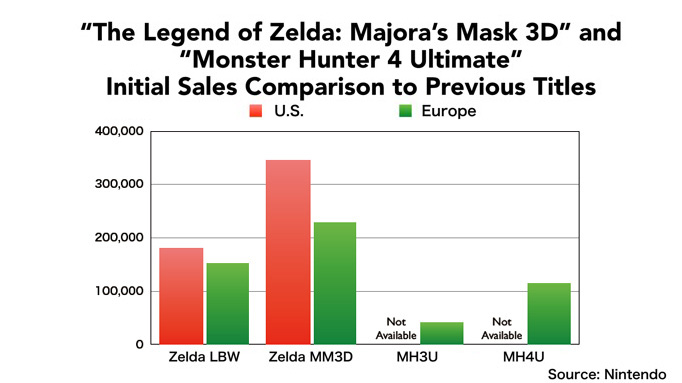
This graph compares our preliminary sales data for “The Legend of Zelda: Majora’s Mask 3D” and “Monster Hunter 4 Ultimate” for the release week (three days for the U.S. and two days for Europe) to the counterparts of their previous works: “The Legend of Zelda: A Link Between Worlds” and “Monster Hunter 3 Ultimate.” The sales of the “Monster Hunter” series in the U.S. are not available in the graph because we have not finished compiling the exact data on the titles, which are published by Capcom, and it was a holiday there yesterday. We have heard from Capcom, however, that the initial sales pace of “Monster Hunter 4 Ultimate,” including the special-edition hardware with the title pre-installed, is more than three times as fast as “Monster Hunter 3 Ultimate” in quick estimation. They both had promising starts thanks to strong pre-orders and their highly-acclaimed gameplay.
Iwata on Wii U sales, including Mario Kart 8 and Smash
Posted on 9 years ago by Brian(@NE_Brian) in News, Wii U | 3 Comments
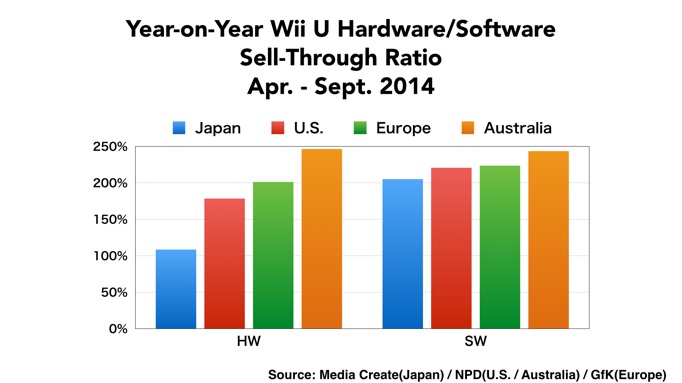
We showed a graph at the Corporate Management Policy Briefing to indicate the growth of the Wii U hardware and software sales in the first half of this fiscal year over the corresponding six months a year ago in Japan, the U.S. and in Europe, and this is the same graph but with the data from Australia.
The sales figures of both hardware and software improved due to various reasons, such as the release of “Mario Kart 8” in May and the re-evaluation of the Wii U platform after E3 in June. The strong growth in Australia can be mainly be attributed to “Mario Kart 8” released in May just before Australia’s unique June-July winter sales season, known as the Toy Catalogue Season.We shipped 4.77 million units of “Mario Kart 8” worldwide as of the end of the last calendar year. I can say it marked a very high attach rate if we consider the current installed base of Wii U hardware.
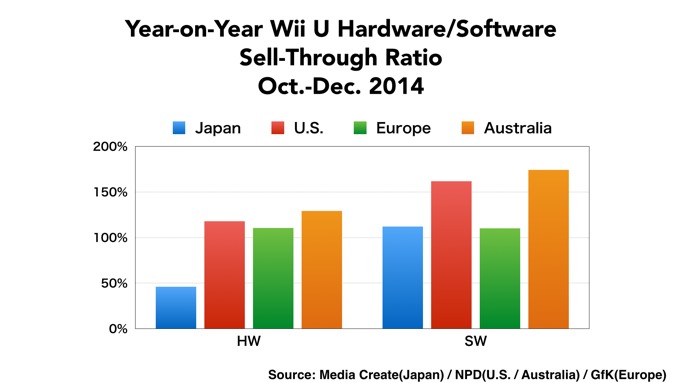
Following the Nintendo 3DS version, we released “Super Smash Bros. for Wii U,” which had shipped 3.39 million units by the end of last year.
As these two classic multiplayer franchises for Nintendo consoles were brought out together,As you can see, the year-on-year comparisons of software sell-through sales in the October-December period show increases in all regions. They especially improved in the U.S. market. We can see larger improvements if we make comparisons among Nintendo titles, especially in the overseas markets.
This is not directly related to this graph, but if we look at the sales figures of only Nintendo titles just in the U.S. for the full calendar year of 2014, the total figure of retail and digital sales represents 175 percent of those for the previous year.On the other hand, hardware sales increased smoothly in overseas markets but decreased in the domestic market. Our analysis of this situation is that in addition to our offers not attracting consumers in the same way as the Premium Family Set bundles did in Japan in 2013, New Nintendo 3DS gained more attention than Wii U, many of the big titles were released for Nintendo 3DS to encourage younger consumers to choose multiple Nintendo 3DS titles, and the priority of purchasing the Wii U console decreased.
Iwata on New 3DS sales
Posted on 9 years ago by Brian(@NE_Brian) in New Nintendo 3DS, News | 3 Comments
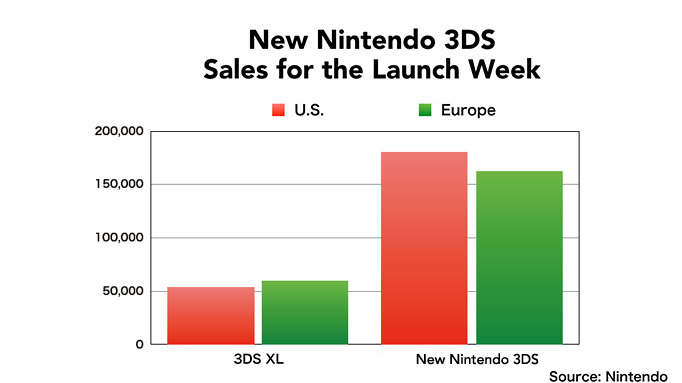
Furthermore, the New Nintendo 3DS models, which we initially released in Japan and Australia, were launched in the U.S. and Europe on February 13. Please note that in the U.S. only New Nintendo 3DS XL is available, which has bigger screens than New Nintendo 3DS.
“The Legend of Zelda: Majora’s Mask 3D” and “Monster Hunter 4 Ultimate” were released on the launch date.As you can see here, we also launched special-edition hardware on that day.
I have received reports that pre-orders for this limited-edition hardware went so well that many retailers closed them before the launch date and the hardware almost sold out on the launch date.Here are our preliminary sales figures for New Nintendo 3DS launched last Friday in each region, and we are comparing the sales for the first two days to those of Nintendo 3DS XL. At the end of last year, some video game enthusiasts, who actively gather information on video games, held off on buying Nintendo 3DS hardware in anticipation of the New Nintendo 3DS launch. Thanks to these consumers and some highly anticipated titles being released simultaneously, we had a good launch despite it not being the usual sales season. Our next challenge is to keep this sales momentum.
Iwata discusses the sales of Smash Bros. 3DS, Pokemon Omega Ruby/Alpha Sapphire, Tomodachi Life
Posted on 9 years ago by Brian(@NE_Brian) in 3DS, News | 3 Comments
“Super Smash Bros. for Nintendo 3DS” was released last September in Japan and last October overseas. We announced at the last Briefing that the number of sales was 3.22 million units by the end of last September and it reached 6.19 million units by the end of the last year.
Before the release, some were skeptical of the sales potential of “Super Smash Bros.” for handheld devices because the series had been popular for home consoles, but the steady sales of the title even today have proven it untrue. The quality of the title has also been highly praised.
The “Super Smash Bros.” series is not as popular or well-known in Europe as in Japan and the U.S. This is why the initial sales of “Super Smash Bros. for Nintendo 3DS” were not strong in Europe. As the time goes by after the release, however, the sales have picked up thanks to word-of-mouth.We have sold 9.35 million units of “Pokémon Omega Ruby” and “Pokémon Alpha Sapphire,” which were released worldwide last November. The sales total is smaller than that of “Pokémon X” and “Pokémon Y,” released in the previous year, as the release date was more than one month later in the year. We are confident that we have a chance to continuously sell “Pokémon Omega Ruby” and “Pokémon Alpha Sapphire” even this year. We will try to have as many people as possible choose them as a standard title. Before the release, some said that these titles were nothing but remakes and that their sales potential was smaller than completely new titles. We hope to produce results that surpass such expectations.
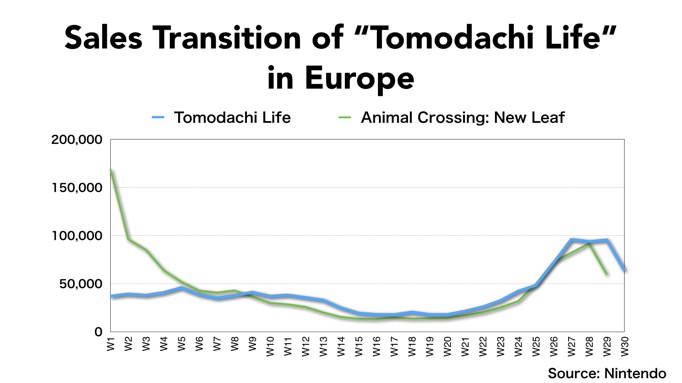
We released “Tomodachi Life” in the overseas markets last June, which is the title released as “Tomodachi Collection: Shin-Seikatsu” (Japanese title) in Japan in 2013, and the global life-to-date sales of this title reached 3.96 million units.
It is interesting to note that the sales pace has been steady in Europe in particular. This graph compares it to the sales transition of “Animal Crossing: New Leaf,” which was released in almost the same period of the previous year. In the overseas markets, “Tomodachi Life” had to make a start as a little known and entirely new IP because the original “Tomodachi Collection” for Nintendo DS was not available there. For your information, this graph shows the weekly sales of each title through the end of the year and the number of weeks for “Tomodachi Life” is one more than that for “Animal Crossing: New Leaf” as “Tomodachi Life” was released one week earlier in the year.
As you can see, “Tomodachi Life” has sold steadily for a long time. The sell-through of the two titles including their digital versions until the end of the calendar year of the respective releases are on the same level: 1.28 million units for “Animal Crossing: New Leaf” and 1.22 million units for “Tomodachi Life.” Considering the difference in their brand awareness and initial sales, it is fair to say that “Tomodachi Life” has achieved good results. It is also notable that the sales in one European country, France, have surpassed those in the U.S.
We can make Nintendo 3DS a more widely received platform by realizing the market potential of such titles as they have fewer competitors in the video game industry and more appeal to female consumers. Actually, “Tomodachi Life” and a pink Nintendo 2DS succeeded in attracting young female European consumers to the platform in the year-end sales season. With the help of the hit “Tomodachi Life,” Nintendo 2DS has made its mark as an entry model in Europe, constituting nearly half of the sales of Nintendo 3DS hardware in the year-end sales season.
Iwata on double-million 3DS sellers
Posted on 9 years ago by Brian(@NE_Brian) in 3DS, News | 0 comments
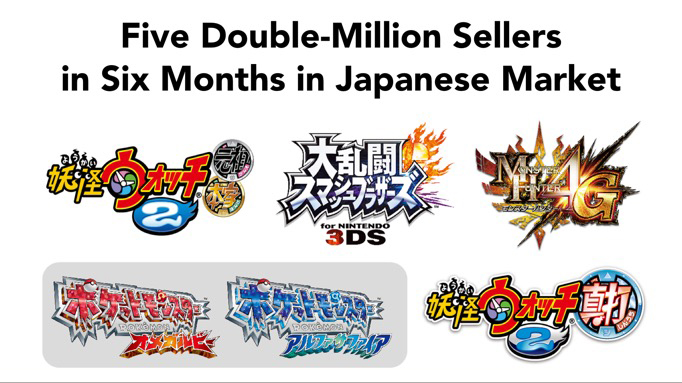
Here are the double-million sellers. Three of the five titles are third-party software. Some think that the popularity of smartphones will shrink the business of software for dedicated video game platforms. On the other hand, the market potential of Nintendo 3DS seems to interest developers who are working on games for smartphones, and there have recently been some hit titles for Nintendo 3DS which were originally designed for smartphones, including “Puzzle & Dragons Z” released at the end of 2013. We continue to receive inquiries from various developers.
More: sales
Iwata talks 3DS sales
Posted on 9 years ago by Brian(@NE_Brian) in 3DS, News | 0 comments

One of the highlights of the financial results is that the total sales of the Nintendo 3DS family hardware have reached 50.41 million units, crossing the 50-million-unit mark.
Various products that can produce 3D images have appeared, but Nintendo 3DS now has an overwhelmingly large presence as a platform with a 3D-projection function.It is hard to say that, however, Nintendo 3DS hardware has sold in this fiscal year as we originally anticipated. Please let me tell you about the differences in the Japanese market and the overseas markets.
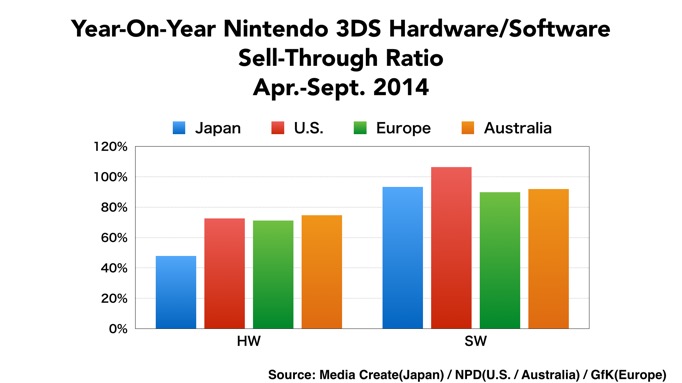
This shows the percentage of change found in the sell-through data of Nintendo 3DS hardware and software in each market for the first half of the term compared to the corresponding first half of the previous year.
During this period, there were intervals between the releases of key titles since the release of “Pokémon X” and “Pokémon Y” in October 2013. This slowed down the pace of the global Nintendo 3DS hardware sales. It was most clear in Japan where the device had been sold at a record-breaking rapid pace since its launch and the number of sales had already surpassed that of Game Boy Advance. The sales in the Japanese market were slower moving in comparison to the previous year than any other market.
In contrast, as you can see, we kept our software business for Nintendo 3DS at a certain size compared to our hardware business, thanks to the releases of “YOKAI WATCH2 GANSO” and “YOKAI WATCH2 HONKE” (Japanese titles) in July and “Super Smash Bros. for Nintendo 3DS” in September in Japan and the steady sales of “Pokémon X” and “Pokémon Y” in overseas markets.This is the sell-through data in each market for the third quarter of this fiscal year compared to that of a year ago.
We launched New Nintendo 3DS on October 11 in Japan, which boosted the hardware sales again. The new device was also made available on November 21 in Australia, but there seems to be no rise in the sales in this graph. This is because, while the launch of “Pokémon X” and “Pokémon Y” and Nintendo 2DS in early October gave momentum to the hardware sales for the full quarter in 2013, the release of New Nintendo 3DS was in late November and therefore did not contribute to the full quarter of last year. Focusing on the single month of December, however, the year-on-year sales were 94 percent of sales one year ago, which was the same level as the Japanese market. In the U.S. and Europe, on the other hand, we were unable to take full advantage of the year-end sales season in selling Nintendo 3DS hardware, despite some hit titles, as some consumers decided to wait for the New Nintendo 3DS, whose launch date was set on February 13, 2015. It is said that the basic principle in the video game industry is good game titles boost hardware sales. In this case, however, New Nintendo 3DS, which has been highly acclaimed by consumers in the markets where it is available, worked to shift consumer demand for the year-end sales season to the next year or to steer it toward other products.
Software sales cannot reach their full potential if a significant amount of the hardware is not newly purchased. As a result, although we released several smash hit titles, the total software sales fell short of the previous year in the U.S. and European markets.
The U.S. data shown here does not include the digital sales, but when we consider only first-party titles for the 2014 calendar year, the combined packaged and digital sales remained almost the same as the previous year, with a 2-percent decline. Since the sales of Nintendo titles for Wii U grew dramatically, which I will tell you about later in this presentation, the sales of first-party titles for Nintendo 3DS and Wii U showed a year-on-year increase of 15 percent.As explained, Nintendo 3DS did not clear all the hurdles with hardware sales, but when it comes to software sales,
First of all, in the Japanese market, Nintendo 3DS software achieved a solid sales result as there were five double-million sellers for Nintendo 3DS in the six months from July to December. At our Corporate Management Policy Briefing last October, we stated that we expected four double-million sellers, and we actually achieved a better result. As I have mentioned before, this is the first time for software for dedicated video game platforms to achieve this record since 2000, when we started to receive precise video game sell-through data in the Japanese market from independent research companies. Considering the size of the video game market before that, we can even say that this is the first time in the history of the Japanese video game market. We did not have so many double-million sellers in such a short period even in the heyday of Nintendo DS, the most pervasive video game system in Japan.
More Nintendo sales data and info – big rise in Wii U software sales, New 3DS XL, amiibo, digital sales boost
Posted on 9 years ago by Brian(@NE_Brian) in 3DS, New Nintendo 3DS, News, Wii U | 4 Comments
Additional information has come out of Nintendo’s latest financial results briefing – sales data in particular. You can find the latest details below.
– Wii U’s software sales in Japan, US, Europe and Australia from April to September increased by over 200 percent from the same period last year
– Multiple factors for this
– One factor is the release of Mario Kart 8 in May and E3 2014
– The increase is especially high in Australia, which is due to their “Toy Catalog Season” in June-July, which lines up with Mario Kart 8’s launch
– Hardware sales also saw a spike in Australia due to the same reasons as the software sales rise
– New 3DS XL in U.S. and Europe sold over three times as much as the original 3DS XL did during its own launch period
– Once again, worldwide amiibo shipments were 5.7 million at the end of 2014
– Iwata says that normally sales of items such as amiibo would drop after the holiday seasons and so the release of new waves and deploying them with titles such as Mario Party 10 will hopefully keep the momentum following
– Nintendo does plan on making a finite number of certain amiibo and letting them sell out
– Though again, some figures will consider producing more stock of figures if there is demand from retailers and consumers
– At the end of third quarter, download sales of digital titles reached 21.1 billion yen
– This is a 17 percent increase from last year
– Nintendo has seen huge increases in digital sales
– There is a significant spike in the US in particular starting from fiscal year 2013
Full breakdown of amiibo sales rankings in North America and other regions
Posted on 9 years ago by Brian(@NE_Brian) in General Nintendo, News | 10 Comments
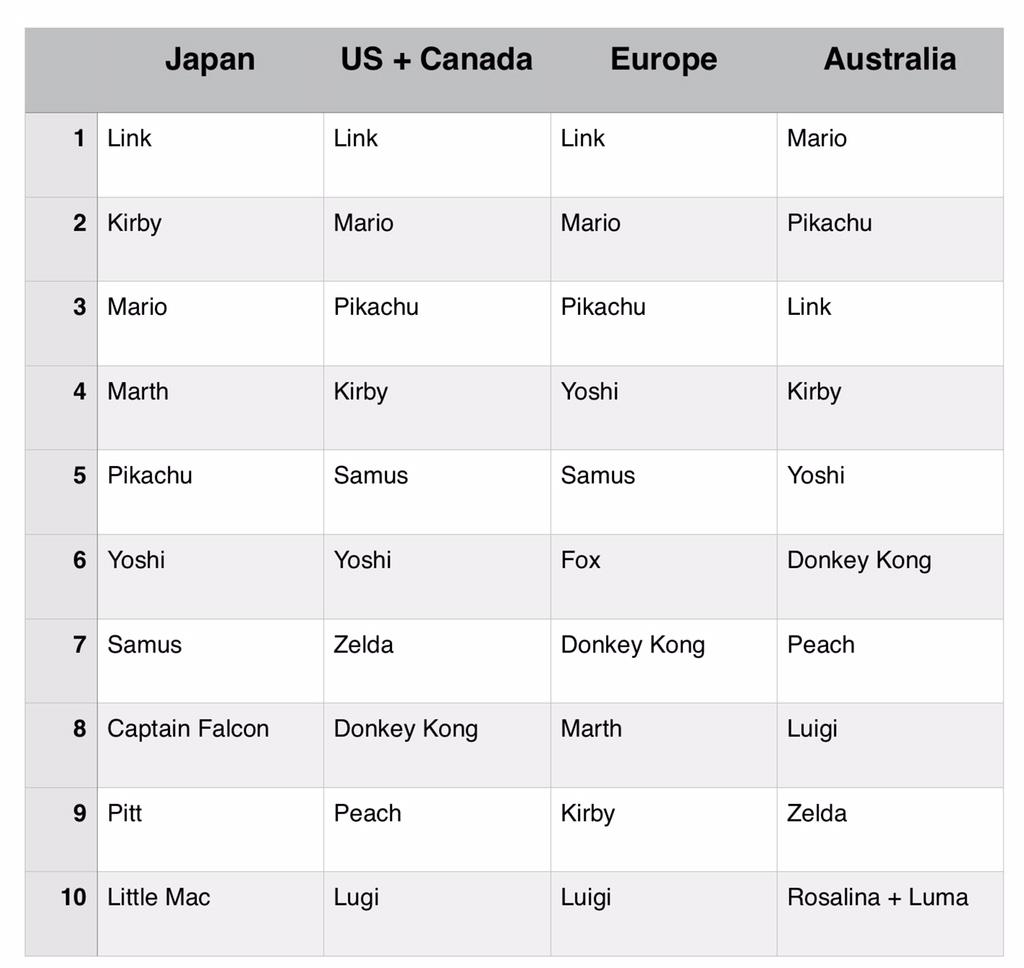
We now have a full breakdown of the best-selling amiibo for each major region. Specific numbers haven’t been provided, though we do have rankings. Check out the full lineups in the graphic above.
The above graphic is for sales rankings. For sell-through rankings (percentage of stock sold), check out the lineups below.
North America
1. Marth
2. Villager
3. Wii Fit Trainer
4. Pit
5. Captain Falcon
6. Link
7. Fox
8. Rosetta & Luma
9. Samus
10. Yoshi